Staff Dashboards
The Staff Dashboard gives you a quick, actionable view of the students assigned to you, along with recent activity and important updates. You can also customize your dashboard by adding tiles from V3 Reports, making it easier to stay organized, spot trends, and take action on your student caseload.
It's designed to help you be more productive, strategic, and student-focused in your daily work.
Dashboards
Dashboard enables staff members to efficiently manage their student caseloads by providing a customizable, at-a-glance view of critical student information and activities. This feature improves productivity and strategic decision-making and leverages our V3 report functionality to customize the dashboard for personalized needs.
*** What dashboard features you see are depended on your role and privileges in Navigate. If you cannot access all the features below email Navigate@wcupa.edu for technical assistance.
(Student names shown are fictious)

Staff members can adjust the layout of My Dashboard by using the  button to drag widgets and lists and arrange the dashboard accordingly.
Save these changes by selecting Save Layout.
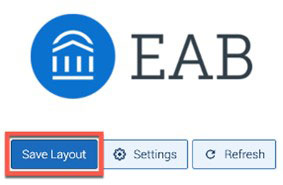
Dashboards refresh daily when the user first opens the page but do not refresh every time the user opens the dashboard. If users want to update a tile or the whole dashboard after the initial daily launch, they need to select the Refresh button.
The Settings button allows you to take two actions: Add Tile and Modify Tile Settings. Modifying Tile Settings allows the user to choose which tiles, including custom tiles, appear on their personal dashboard.
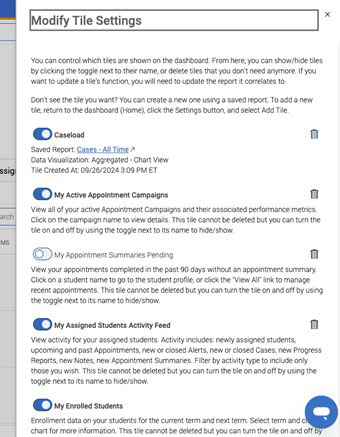
When you change a tile setting, select Save Settings to update the dashboard.
Dashboards are available to any users with a Role with a Staff user type enabled. This includes Advisor, Tutor, and Coach. Beyond this, staff users need the correct existing permission to see data on the Dashboard or to see the Actions Menus on the tiles. If you do not have the View Alerts permission, the alerts do not show in the Activity Feed.
There are seven pre-created tiles available on the Dashboard, as well as any custom-created
ones the user has made. Various settings are controlled by the Settings button and buttons in the corner of the tile. You can refresh data on any tile by
clicking the  icon. Each tile also has a label informing users of the date and time it was last
refreshed.
icon. Each tile also has a label informing users of the date and time it was last
refreshed.
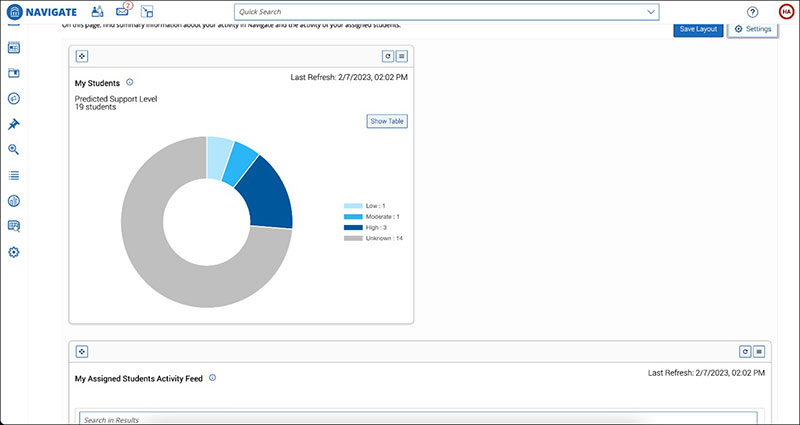
My Students
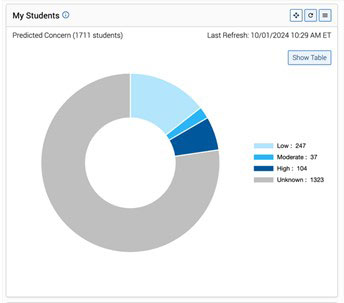
This tile shows several types of aggregate information about your assigned students. You can change what displays by opening the menu and choosing from the options.

- Select Audience. This option displays your students by audience.
- Select View. This option lets you choose which graph you want to see.
Each option lets you view the list of students by clicking on a segment of students.
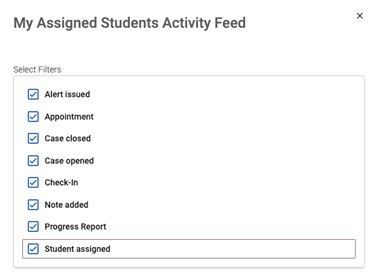
My Assigned Students Activity Feed
This tile is an aggregated list of activities for your assigned students. Only the student activities you have access to will be displayed in this list. For example, you only see Alerts Issued if you can see Alerts on your students.

The activities included in the feed are:
- Alert Issued
- Appointment Scheduled
- Case Closed
- Case Opened
- Check in
- Note Added
- Progress Reports Added
- New student assigned to you
This tile includes a filter that lets you choose which activity types to see in the feed. You must set the filter every time you open the Dashboard.
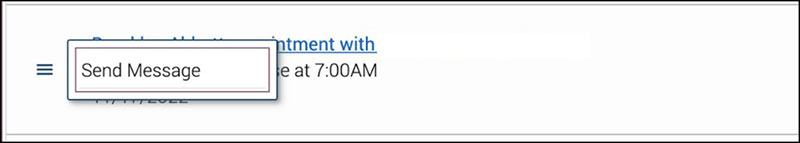
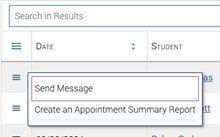
Staff can send a student a message if they have permission by opening the hamburger menu in front of a feed entry.
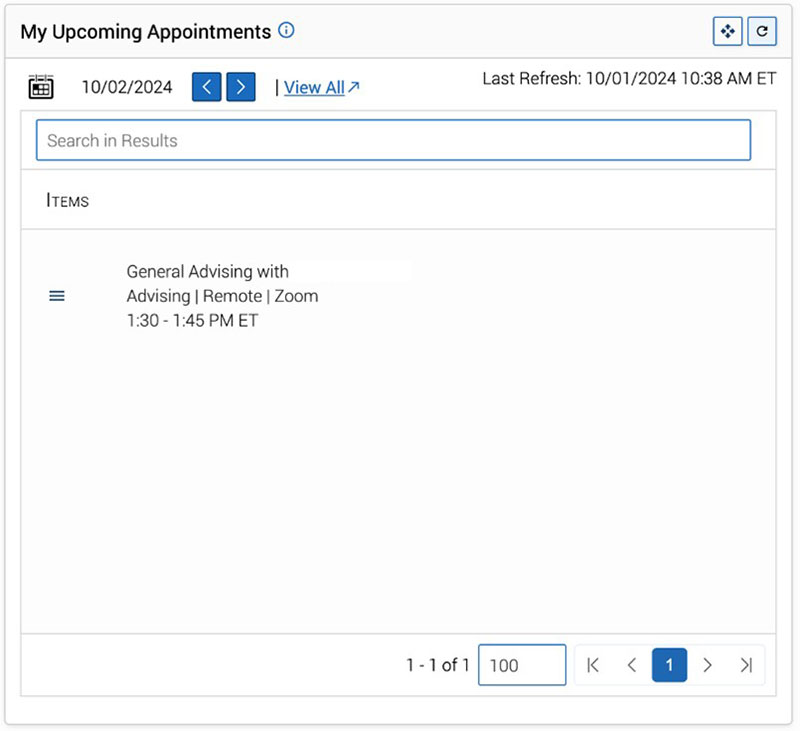
My Upcoming Appointments
This tile shows a list of upcoming appointments for the staff member. Staff can change the date for the tile and view all appointments by selecting the View All link, which opens the Staff Home page.
My Appointment Summaries Pending
This tile shows a list of appointments you had in the past 90 days that do not have Appointment Summaries. In this case, it does not matter if the student you met with was assigned to you or not.

Clicking the students' name opens their Student Profile. You can also click the hamburger menu in front of the student's name to open the Actions Menu.
You can also see all your recent appointments by selecting the View All link on the tile.
My Enrolled Students
This tile shows a pie graph of the staff member's assigned students who have enrolled for the selected term and those who haven't. By clicking a segment, staff open a list of the students who have/have not enrolled.
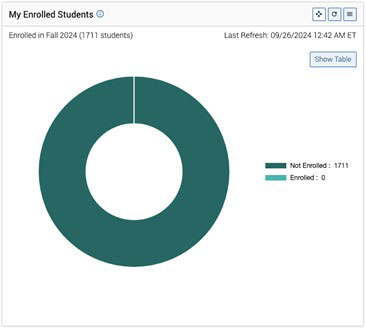
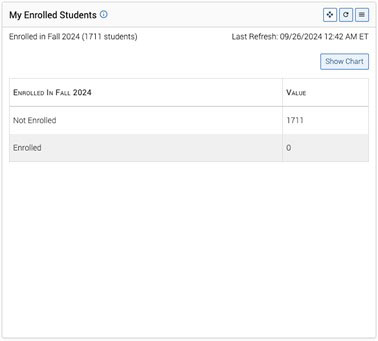
Clicking Show Table shows this information in list form.
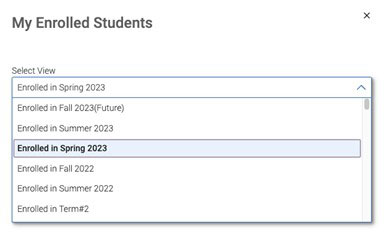
Staff can change the term in the My Enrolled Students tile by clicking the menu icon  A filter with all available terms opens.
My Appointment Campaigns
This tile shows a list of active Appointment Campaigns you created. Selecting the View All link opens the associated Appointment Campaigns.
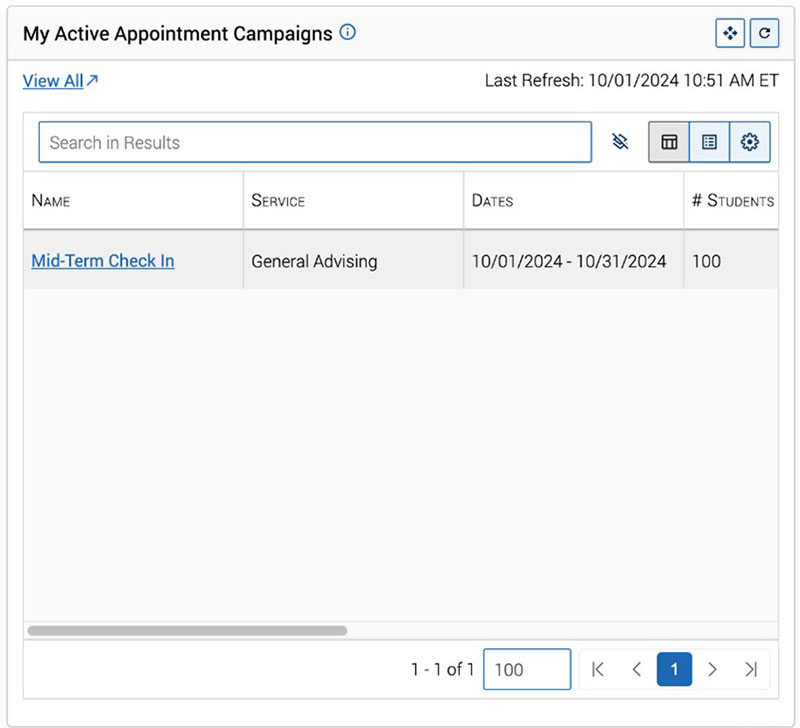
Each active Appointment Campaign on the tile includes the following associated metrics: Number of Students, Appointments Scheduled, Attendance Rate, and Appointment Summaries Created.
My Enrollment Campaigns
This tile shows any active Enrollment Campaigns you are involved in. Clicking the name of the Enrollment Campaign takes you to that campaign on the Campaigns tab.
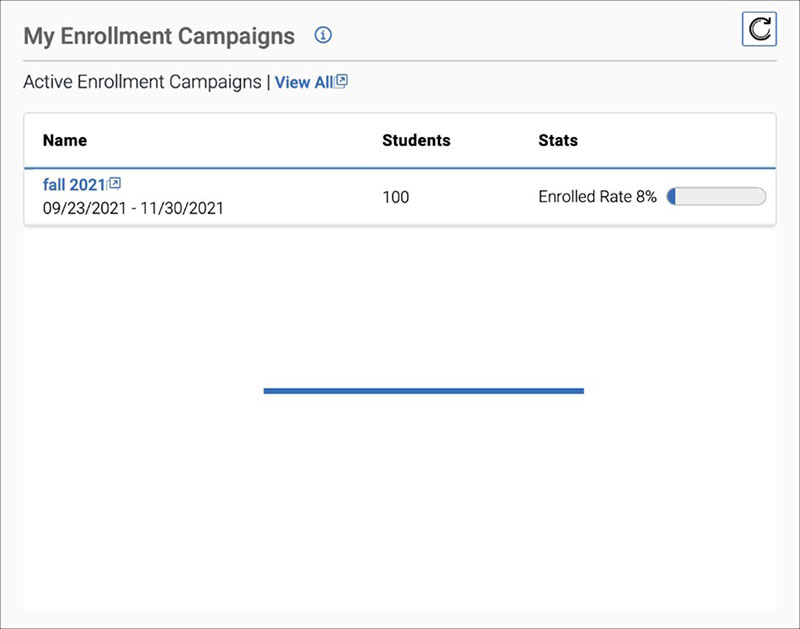
Each active Enrollment Campaign in the list includes the following associated metrics: Number of Students, Stats. The stat shown is the Enrollment Rate of students in the campaign.
Creating and Editing Staff Dashboard Tiles
Important. The sample report and tile created in this article is meant to be an example; it may not reflect realistic data and is not the only type of tile users can create for the Staff Dashboard.
Users can create their own custom tiles for Staff Dashboard. In this article, we are going to show the steps needed to create a tile that shows the user's case load. To do this, users need access to the V3 Reports, specifically the Cases Report.
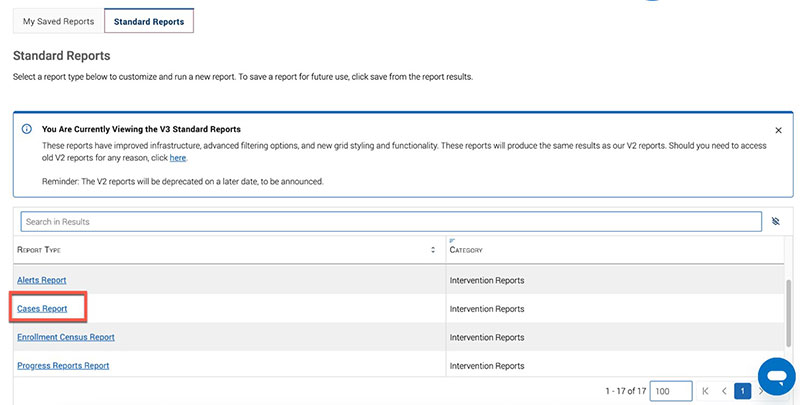
Building and Saving a Report
Open the Standard Reports tab in V3 Reports. For this example, select Cases Report from the list.
Next, set your filters. For this example, the filter was Opened at Date is not empty. If the user wanted to view their own cases, they could also add the field Owner (user list), the condition contains any and choose their own name as the value. Select Run Report.
The Report Results display.

At this point, save your report. Next, we create a basic pivot table so that a graph can be displayed on the dashboard.
Creating a Pivot Table
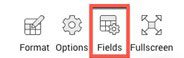
Select the Load Pivot Table icon.  The pivot table page opens as a table. Select Fields from the top bar.
Set your rows, columns, and values. In this example, the row is Opened By, the value is count of Student Names, and the column is value.
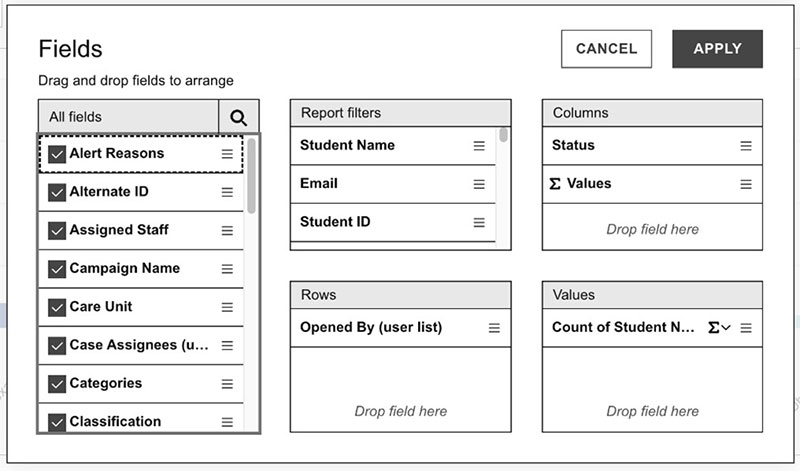
Once you have set your fields, click Apply. Next, re-save your report by selecting Save As… and then saving the report.
Adding the Tile to the Dashboard
Now that you have a saved report and a saved pivot table, return to the Staff Dashboard.
Select Add Tile. The Add Tile menu panel opens.
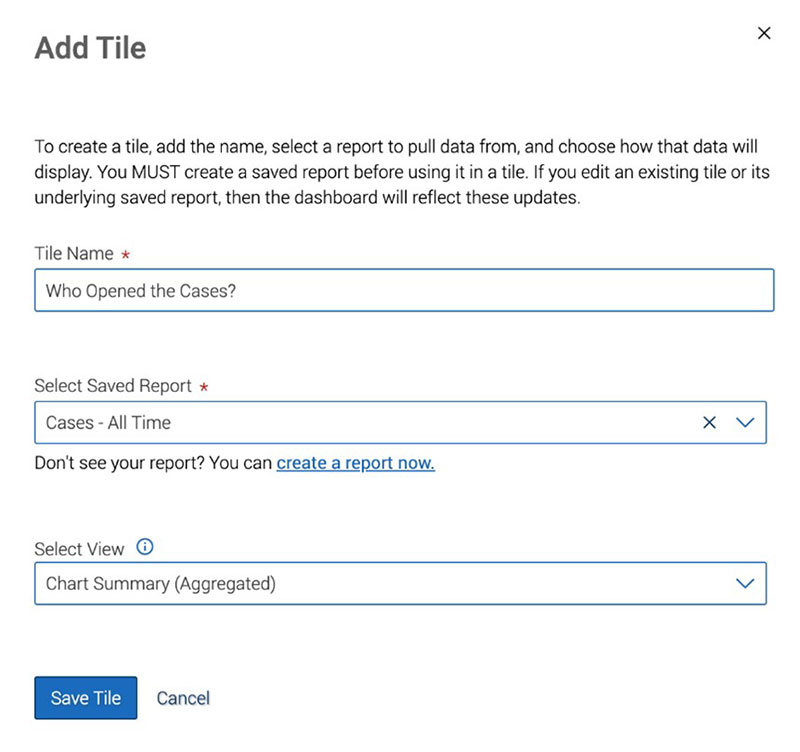
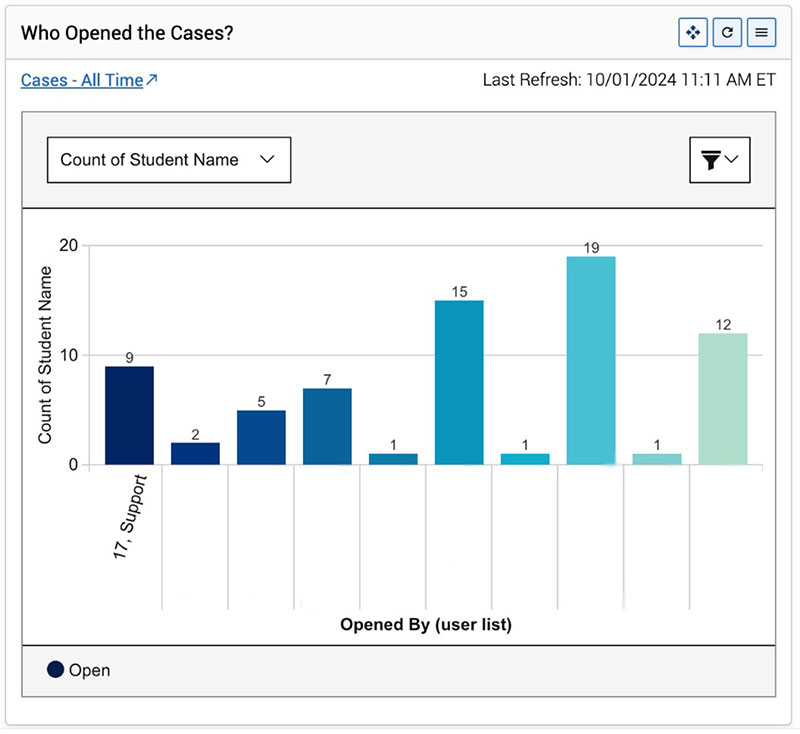
Name your tile. Select a saved report from the dropdown field. In this example, it's the Who Opened the Cases?
Next, select your view from one of the three options:
- Detail View (Disaggregated): Shows a list of results from your report in a disaggregated view, essentially the report results. This view allows you to take actions on students directly from the dashboard tile.
- Chart Summary (Aggregated): Shows the pivot table chart you created, if you have done so. If you have not yet created a pivot table chart, the application will not create the tile from your saved report.
- Table View (Aggregated): Shows an aggregated grid you created with the pivot table tool. If you have not created a table view, the application will not create the tile using this view with your saved report.
After selecting these options, click Save Tile. The tile will now appear on Staff Dashboard.